Organize a Graph
RustEdit ProBig graphs get hard to read. Portals send a value across the graph without a long wire, group boxes frame the nodes that belong together, and node previews show the result of each node. They work in the Terrain Graph window and in the Brush Graph window.
Portals
A portal sends a value across the graph without a long wire. Big graphs use them to stay readable.
- Right-click an output port and pick Send to Portal. A small named pill appears beside the port. Type a name for it.
- Right-click an input port anywhere in the graph, pick Receive from Portal, then pick the portal's name. A pill appears beside that input. It gets what the first pill sends.
Hover a pill to see dashed lines to the pills it is linked with. Double-click a sending pill to rename it. To switch a receiving pill to another portal, right-click it and pick from Portal. Portals that do not fit the input, or that would make a loop, are grayed out.
Portal In and Portal Out are not in the Add Node menu: you make them only from a port's right-click menu.
Group boxes
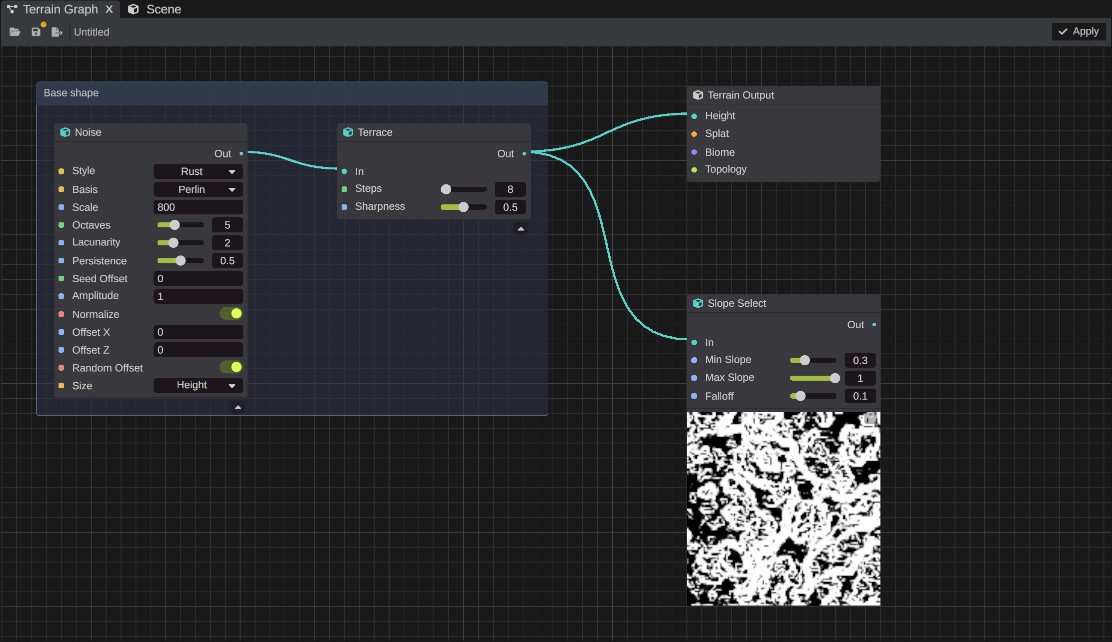
A group box is a named frame around nodes. Moving the box moves the nodes in it.
- Select the nodes. See Select nodes.
- Press Ctrl+G, or right-click one of them and pick Group Selection. A box appears around them. Type its name.
You can also right-click the empty canvas and pick Create Group for an empty box. Drag nodes into it.
- Drag the box's title bar to move it. Every node whose middle is inside the box moves with it.
- Drag the box's left, right or bottom edge, or a bottom corner, to resize it.
- Double-click the title to rename the box.
- Right-click the title for Rename, Select Nodes and Delete Group. Deleting a group keeps the nodes in it.
When a node inside a box grows, for example when you turn on its preview, the box grows with it.
Node previews
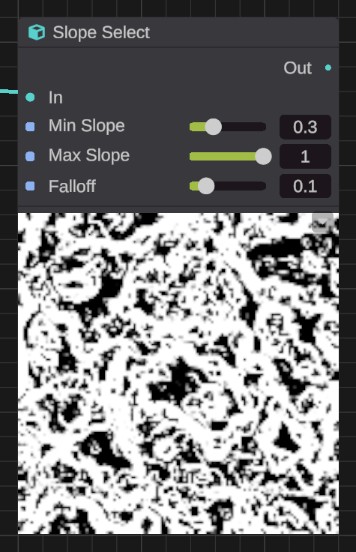
A node can show a small picture of its result, so you can see what each part of the graph does.
- Click the arrow button on the node's body, or right-click the node and pick Preview. The picture shows on the node. Do the same again to hide it.
What the picture shows:
- Height and masks show in gray. Splat shows the ground colors, biome shows the biome colors, and topology shows white where any flag is set. An RGBA map shows its color, with its fourth channel as a strip down the right edge.
- Nodes that only give numbers have no preview.
Only nodes that lead to the Terrain Output run, so a node that is not wired toward it shows no picture. Inside a custom node, every node runs.
Previews are not saved in the graph file. They turn off when you hide or close the window.